Now, let's make surfaces using the function plot3d(.).
This function is called like this: plot3d(x, y, z);
Where x and y are vectors and z is a matrix.
Look the example:
-->d = -3:3;
-->[x y] = meshgrid(d)
y =
- 3. - 3. - 3. - 3. - 3. - 3. - 3.
- 2. - 2. - 2. - 2. - 2. - 2. - 2.
- 1. - 1. - 1. - 1. - 1. - 1. - 1.
0. 0. 0. 0. 0. 0. 0.
1. 1. 1. 1. 1. 1. 1.
2. 2. 2. 2. 2. 2. 2.
3. 3. 3. 3. 3. 3. 3.
x =
- 3. - 2. - 1. 0. 1. 2. 3.
- 3. - 2. - 1. 0. 1. 2. 3.
- 3. - 2. - 1. 0. 1. 2. 3.
- 3. - 2. - 1. 0. 1. 2. 3.
- 3. - 2. - 1. 0. 1. 2. 3.
- 3. - 2. - 1. 0. 1. 2. 3.
- 3. - 2. - 1. 0. 1. 2. 3.
-->z = 9 - (x.^2 + y.^2);
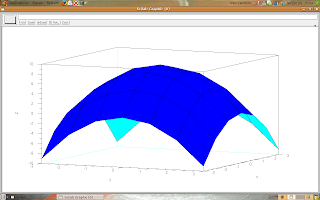
-->plot3d(d, d, z);
The result is showed:

The coordinates x and y were the vector d (-3:3).
We can make any surface, so let's think in other surface. Look the next example:
-->x = -5:0.1:5;
-->y = 0:0.1:10;
-->[xc yc] = meshgrid(x, y);
-->w = %pi/4;
-->b = -0.5;
-->z = exp(b*yc).*sin(w*xc);
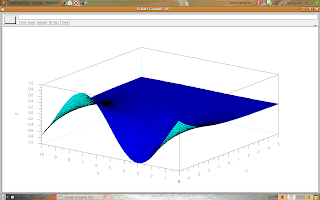
-->plot3d(x, y, z);
The result:

Try to make tests and generate surfaces.
12 comments:
Great job you are doing here.
Found you blog by chance and it
taught me a lot about scilab.
Thanks and keep on the good work.
hai sheep...
a question, is it possible to combine the curve with its vector representative? i mean display the graph and at the same time we can see the direction of the data.
I'm not sure about your question, Naza.
Do you want to show a surface and its gradient?
If you explain me what you want, then I can try to help you.
Thanks for the comments.
Yeah you are right. Surface or just simple curve and its gradient, like a Gradient Search technique. This one found application in many area, such as System Optimization.
I have a question about this, please!
I have 2 arrays, x and y. both have 20 elements. There's a mathematical relationship between x and y that would give P, pressure.
x runs from -1.0 to 1.0
y runs from -1.0 to 0.2
I need to make a 20 by 20 grid with corresponding x and y values.
at any point, depending on the values of x and y, P is colored.
so i guess i need a for loop afterwards...
Please for now i just need to learn a for loop to make the 20 by 20 grid.
thanks
Stanley
what does the dot mean here .. for example x.^2 .. I don't understand it
The dot means it is a matrix element-wise operation. So, instead of doing matrix multiplication x * x, you multiply each element of x by the corresponding element in x, i.e. ans(0,0) = x(0,0) ** 2
Hi sheep,
Can we use plot3d() function inside a C-program?
Hello Pranav.
Probably there is any way for calling plot3d() Scilab function inside a C-program, but if you are using Linux operating system, so you can look for Gnuplot. There is a very useful library for C++ that makes a great integration with Gnuplot.
If you use another operating system, you can pass data from C-program to Scilab through files, for example.
hey sheep,
I'm a beginner in scilab. Can u pls explain me how to draw a rectangular surface in 3-dimensions?
Thanks in advance..
I have done two others posts about surfaces plots: http://usingscilab.blogspot.com.br/2012/09/plot3d-rectangular-surface.html and http://usingscilab.blogspot.com.br/2012/09/plot3d2-creating-cube.html
Look there for more information about it.
Best regards to all.
any idea how to export a surface as a nurbs model of some type? it'd be cool to be able to load this into a 3D CAD program (then CNC).
thanks!
Post a Comment