Wednesday, July 29, 2009

Color vectors

I received a comment (here) asking about color in plotting vectors.

Ok, I'd not write about properties of figures but the reader's satisfaction is more important.

We can manipulate any property of the graphs in Scilab as following:

--> set("figure_style","new"); //create a figure in entity mode

-->f = get("current_figure")
f =

Handle of type "Figure" with properties:
========================================
children: "Axes"
figure_style = "new"
figure_position = [655,473]
figure_size = [610,461]
axes_size = [596,397]
auto_resize = "on"
figure_name = "Scilab Graphic (%d)"
figure_id = 0
color_map= matrix 32x3
pixmap = "off"
pixel_drawing_mode = "copy"
immediate_drawing = "on"
background = -2
visible = "on"
rotation_style = "unary"
user_data = []

--> a = f.children // the handle on the Axes child


Now, let's set the desired color:

--> a.foreground = 5;

And we can make the graph:

--> x = [1:10]';

--> y = [1:10]';

--> [vx vy] = meshgrid(x, y);

--> champ(x, y, vx, vy, 1);


The result is:
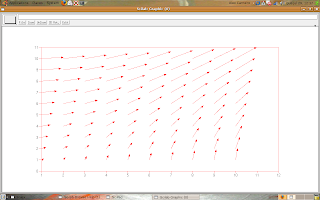

But, we want more! Let's continue the script as following:

--> a.foreground = 3;

--> x = 10 + [1:10]';

--> y = 10 + [1:10]';

--> [vx vy] = meshgrid(x, y);

--> champ(x, y, vx, vy, 1);


The result is:
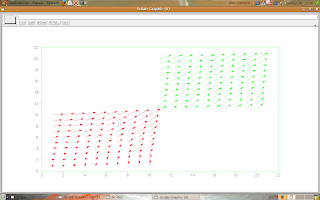

The foreground element, called in

--> a.foreground = n; // n is a number that represents the desired color

may be any of these values:

  • 1 - black
  • 2 - blue
  • 3 - green
  • 4 - cyan
  • 5 - red
  • 6 - magenta
  • 7 - yellow
  • 8 - white
  • 9 - dark blue

Scilab can make graphs with more colors (for the numbers higher or equal than 10), but you are smart for test it.

If you want a black bound (look that the made graphs, the bound's color is the same of the vectors) you have to put the command

--> a.foreground = 1;

after the champ(.) function:

That's all, now the unknown reader can plot vectors with colors.

Wednesday, July 22, 2009

Lists in Scilab

Hi everybody, I couldn't post anything last week because I was in a retreat.

Let's study something about lists in Scilab now.

Lists are a type of variables like vectors, but each element may be of any type.

In vectors, all elements are of the same type (vectors of integers, doubles, strings, etc...).

In lists, we may have many types of variables.


Creating a list:

Scilab has a function called list(.) and it may be used with any quantity of elements. Look the examples:


-->person1 = list("Josh", 25, 1.8, 80, "soccer");

-->person2 = list("Mary", 22, 1.6, 55, "tennis");

-->person3 = list("Peter", 30, 1.75, 100, "chess");

-->person1
person1 =


person1(1)

Josh

person1(2)

25.

person1(3)

1.8

person1(4)

80.

person1(5)

soccer

-->person2
person2 =


person2(1)

Mary

person2(2)

22.

person2(3)

1.6

person2(4)

55.

person2(5)

tennis

-->person3
person3 =


person3(1)

Peter

person3(2)

30.

person3(3)

1.75

person3(4)

100.

person3(5)

chess


Each person has five informations:

  1. Name
  2. Age
  3. Height
  4. Weight
  5. Favorite sport

But, if we want to insert more informations, then we can do:

-->person1($ + 1) = "male"
person1 =


person1(1)

Josh

person1(2)

25.

person1(3)

1.8

person1(4)

80.

person1(5)

soccer

person1(6)

male

-->person2($ + 1) = "female"
person2 =


person2(1)

Mary

person2(2)

22.

person2(3)

1.6

person2(4)

55.

person2(5)

tennis

person2(6)

female

-->person3($ + 1) = "male"
person3 =


person3(1)

Peter

person3(2)

30.

person3(3)

1.75

person3(4)

100.

person3(5)

chess

person3(6)

male


The indexes may be manipulated for insert new elements in any point of the list.

If anyone has any question about lists (or others subjects), I can try to answer.

Tuesday, July 7, 2009

A car and a truck

What's the difference between a car and a truck?

Scilab explains it! Look the Scilab's example video:


Open the window of examples (demonstrations) clicking the Demos button, so you can try all the examples.