This post is about a good subject in many areas of engineering and informatics: the Fourier Transform. The continuous Fourier Transform is defined as:
f(t) is a continuous function and F(w) is the Fourier Transform of f(t).
But, the computers don't work with continuous functions, so we should use the discrete form of the Fourier Transform:
f[n] is a discrete function of N elements, F[p] is a discrete and periodic function of period N, so we calculate just N (0 to N - 1) elements for F[p].
Who studies digital signal processing or instrumentation and control knows the utilities of this equation.
Now, how to use the Fourier Transform in Scilab?
If we are using large signals, like audio files, the discrete Fourier Transform is not a good idea, then we can use the fast Fourier Transform (used with discrete signals), look the script:
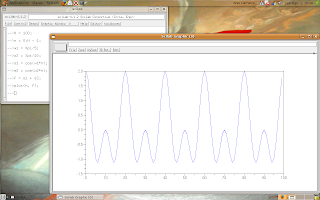
-->N = 100; // number of elements of the signal
-->n = 0:N - 1;
-->w1 = %pi/5; // 1st frequency
-->w2 = %pi/10; // 2nd frequency
-->s1 = cos(w1*n); // 1st component of the signal
-->s2 = cos(w2*n); // 2nd component of the signal
-->f = s1 + s2; // signal
-->plot(n, f);
The result is:
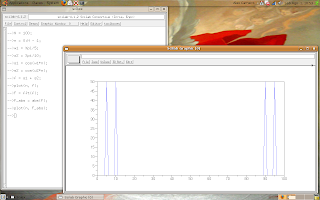
Now, let's study the Fourier Transform of our signal.
-->F = fft(f); // it calculates the Fourier Transform
-->F_abs = abs(F); // F_abs is the absolute value of each element of F
-->plot(n, F_abs);
The result is:
The Fourier Transform is a linear transformation, thus it has a inverse transformation: the Inverse Fourier Transform.
Scilab has the function ifft(.) for obtain the original signal from it Fourier Transform.
If anyone wants to know, I can make a new post about how to identify the frequencies of the original signal in the Fourier Transform.

f(t) is a continuous function and F(w) is the Fourier Transform of f(t).
But, the computers don't work with continuous functions, so we should use the discrete form of the Fourier Transform:

f[n] is a discrete function of N elements, F[p] is a discrete and periodic function of period N, so we calculate just N (0 to N - 1) elements for F[p].
Who studies digital signal processing or instrumentation and control knows the utilities of this equation.
Now, how to use the Fourier Transform in Scilab?
If we are using large signals, like audio files, the discrete Fourier Transform is not a good idea, then we can use the fast Fourier Transform (used with discrete signals), look the script:
-->N = 100; // number of elements of the signal
-->n = 0:N - 1;
-->w1 = %pi/5; // 1st frequency
-->w2 = %pi/10; // 2nd frequency
-->s1 = cos(w1*n); // 1st component of the signal
-->s2 = cos(w2*n); // 2nd component of the signal
-->f = s1 + s2; // signal
-->plot(n, f);
The result is:

Now, let's study the Fourier Transform of our signal.
-->F = fft(f); // it calculates the Fourier Transform
-->F_abs = abs(F); // F_abs is the absolute value of each element of F
-->plot(n, F_abs);
The result is:

Look at the two graph's peaks, one for the component s1 and the other for the component s2.
The Fourier Transform is a linear transformation, thus it has a inverse transformation: the Inverse Fourier Transform.
Scilab has the function ifft(.) for obtain the original signal from it Fourier Transform.
If anyone wants to know, I can make a new post about how to identify the frequencies of the original signal in the Fourier Transform.
16 comments:
"If anyone wants to know, I can make a new post about how to identify the frequencies of the original signal in the Fourier Transform. "
Please do that! I'm doing a plot of some data both in time- and frequency domain. I have been experimenting with the fftshift and now I just need to know how to get the frequency axis right. If you could assist me on this I would be very thankful!
To all users of this tip.
1.Each line of the commands e.g. w2 = %pi/10 must be tapped separately!! So after each line we click Enter.
2. After the command line there goes no ";" sign cuz Scilab shows Error 2
To the author. I'm very grateful for posting about FFT but try to be more specific in the future :)
the function from fft always even function?
Abdillah, abs of fft is an even function, remember fft gives complex numbers, which have real and imaginary components.
excuse me sir. how to plot fourier series in scilab?
please give another example in sinus-cosinus fourier series...
thank you sir
Hi Alex, thank you for this post. By any chance do you know how to obtain a complex number in the form of A +iB, representing the sinusoidal function with biggest magnitude after fft?
Hello nameless reader, I'm not sure about you issue, but see this following code:
-->w = %pi/3;
-->t = 0:10;
-->x = sin(t*w);
-->X = fft(x)'
X =
0.8660254
1.067457 - 0.6860129i
- 2.1266183 + 4.6566444i
0.0959407 + 0.6672822i
0.2455387 + 0.2833668i
0.2846692 + 0.0835864i
0.2846692 - 0.0835864i
0.2455387 - 0.2833668i
0.0959407 - 0.6672822i
- 2.1266183 - 4.6566444i
1.067457 + 0.6860129i
-->abs(X)
ans =
0.8660254
1.2688886
5.1192619
0.6741440
0.3749480
0.2966871
0.2966871
0.3749480
0.6741440
5.1192619
1.2688886
Is it your question?
Can you please suggest me, how can I apply fft command to an image in SCILAB?
Dear Hetal Rao, use fft2 function for each channel of your image.
fft2 implements a 2D Fast Fourier Transform.
Regards!
can i get a programm for exponentiaol to the power of -x^2
Dear Anonymous reader, you can try
-x.^2
take attention to the dot '.' between 'x' and '^'
I hope to have helped you.
i want a programm of it in scilab
how can i vary x ;
it would really b greatful
if someone let me know what would b the gausian curve in fft graph??
y in the above program we have 4 gignals output
even if i apply fftshift dan also it shows 4 outputs/signals
Every person has the passion in any aspects or things.
If you love something and it came in front of you it completes your day and your mood turns into something you won't expected.
I love your work and I want to read more about it. Visit my site if you have time . Thank you.
triciajoy.com
www.triciajoy.com
Fs=1/Ts
df=Fs/n
f=-fs/2:df:fs/2-df
Post a Comment